In previous parts of this article, we covered an overview of Lean Startups and its Build-Measure-Learn (BML) methodology. We also detailed the Build portion of the cycle, including the Minimum Viable Product and its importance to the Lean Startup approach.
To summarize Lean Startup, the method was created by Eric Ries and detailed in his groundbreaking book The Lean Startup[1] back in 2011. Lean Startup can guide product development, shorten development cycles, and help us deliver the products and features customers need, not just what they tell us they need.
In this part, we’ll examine the next portion of the B-M-L cycle, Measure, and why it is crucial to success.
MEASURE
After building a product or features of a product, the second part of the Lean Startup method is measuring how that product is adopted and used. Tools such as focus groups and surveys are useful measuring tools. But beware of over-relying on them since focus groups only reveal how people feel and surveys only tell us what they think.
Beware also of so-called “Vanity Metrics” since they tend to make us feel good and don’t lead to the kind of learning we need. These metrics tend to be easy to capture, such as the number of users or site visits, and may show false progress. For example:
- The number of visitors to a web site is easy to measure and seeing an increase after a product launch feels good.
- Let’s say your team uses a strategy of offering a free version of a product to attract potential paying customers. A large spike in new product users is a vanity metric since it masks how people like the product or how likely they are to become paying members.
Instead, we need to find what I call “Metrics that Matter.” Those are usually harder to obtain, but typically more meaningful. For the above two examples:
- Measuring the number of site visitors who return to the website and how quickly they return is harder to measure but gives a better sense of meaningful customer interest.
- Tracking the free members who convert to paying customers is harder than just measuring the new members. But those conversions are a much more meaningful measurement – just ask any digital marketing person about the importance of conversions.
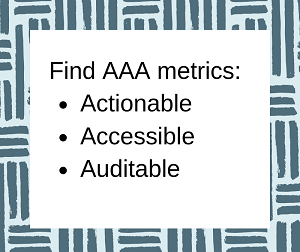
To focus on metrics that matter, Eric Ries suggests we use AAA metrics1, which are:
- Actionable – these must prove a clear cause and effect otherwise they are vanity metrics. They should also be significant enough to base a decision on. Example: discovering a new feature that is not used much and then dropping it or deciding not to enhance it.
 Accessible – the product team needs to be able to access the measures to gather, analyze, and learn from them. For example, Google Analytics is useful for web site measurements and is highly accessible. But, that tool can provide plenty of vanity metrics such as the number of site visits per month. More significant would be to measure the number of people returning in subsequent months and then doing “cohort analysis” on groups of returning customers using Google Analytics.
- Auditable – ensure the data is credible and can be verified. Often this means spot-checking the data with real customers. Auditable also means to keep reporting processes simple, preferably with data directly from operational data (vs. manual manipulation). What this means is that the process by which measures are obtained is simple and can be independently verified. Example: surveying customers directly to verify their purchase decisions.
Measure – 9 Techniques
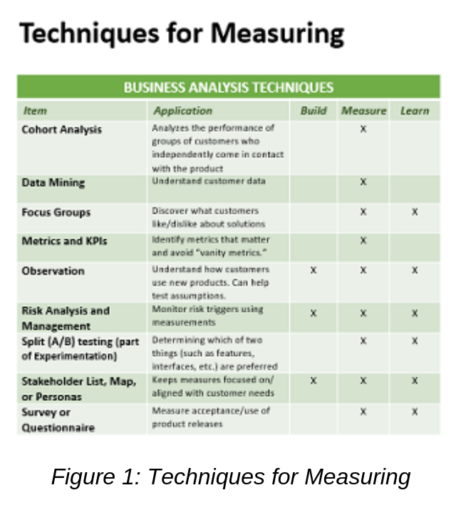
Figure 1 below shows a list of nine standard Business Analysis techniques that will assist in the Measurement part of the B-M-L cycle. In addition, below are two that are not yet in the IIBA or PMI standards, but are still important in the Measuring phase.
Cohort Analysis – important for a startup to track how groups of related customers or customer segments are acquired and retained. Cohorts can help us determine which features will be valued by different segments. Google Analytics has a new cohort analysis tool that can help. Cohort analysis is like the use of personas which group users by various characteristics. But the two differ in that cohorts are established by their current and past behavior, not by projected traits, and we can measure cohort behavior.
A/B Split testing – is a simple and effective way to run an experiment to learn which features are used, which marketing messages appeal better, even which kinds of web pages are more effective at promoting a product.
Two test groups are given different product versions to see which group adopts and uses which version to determine the one that is most effective. The differences are usually controlled to see which feature(s) made the biggest difference. Often the versions are tested in a live, production environment to not slow down progress.
It is not an official technique in any BA standard but is referred to as part of experiments.
In summary, the Measure stage of the Lean Startup methodology lays the groundwork for us to learn what worked and what didn’t with what we built. The measures and the learning from those measures are what separates an ordinary Agile effort from a Lean Startup. I also feel the “M-L” work we do contributes to greater – and faster – success with products we release than with typical delivery cycles.
Some important facets to remember about measuring are to avoid “vanity metrics,” which are easy-to-capture measures that are inclined to make the team feel better about making progress. It is far better to discover “metrics that matter” using AAA metrics –Actionable, Accessible, and Auditable. These are often harder to obtain but will enable the greatest learning.
Speaking of learning, the final part of this series covers the Learn portion of the B-M-L methodology of Lean Startup.
[1] Eric Ries, The Lean Startup: How Today’s Entrepreneurs Use Continuous Innovation to Create Radically Successful Businesses, New York: Crown Business Books, 2011
Richard Larson, PMP, CBAP, PMI-PBA, was the founder of and is now a consultant for Watermark Learning. He is a successful entrepreneur with over 35 years of experience in product development, business analysis, project management, training, and consulting. As an internal entrepreneur, Rich led the development of several Watermark Learning online products as a business analyst and product owner.
Rich is a frequent speaker at Business Analysis and Project Management national conferences and IIBA® and PMI® chapters around the world. He has contributed as a lead author to the BA Body of Knowledge version 2.0 and 3.0 and was a lead author on PMI’s Business Analysis Practice Guide. He and his wife Elizabeth Larson have co-authored five books on business analysis.


 New Horizons
 Project Management Academy
 Six Sigma Online
 Velopi
 Watermark Learning
 Login
Login


 New Horizons
 Project Management Academy
 Velopi
 Six Sigma Online
 Watermark Learning